AI & Data Science System Architecture
The full 8-step end-to-end data science & ML lifecycle (problem definition & data strategy, data ingestion & storage, data preparation & exploration, modeling & training, evaluation & validation, deployment & inference, monitoring & observability, and feedback & continuous improvement), the seven core disciplines that make up the practice (data engineering & management, exploratory data analysis, machine learning, deep learning & neural networks, LLMs/RAG & generative AI, MLOps & deployment engineering, and monitoring/governance/responsible AI), a typical data & ML pipeline architecture, a RAG/generative AI pipeline example, and a model monitoring loop showing how data, models, and applications connect in production. Hover, tap, or focus any component for its description and standard reference.
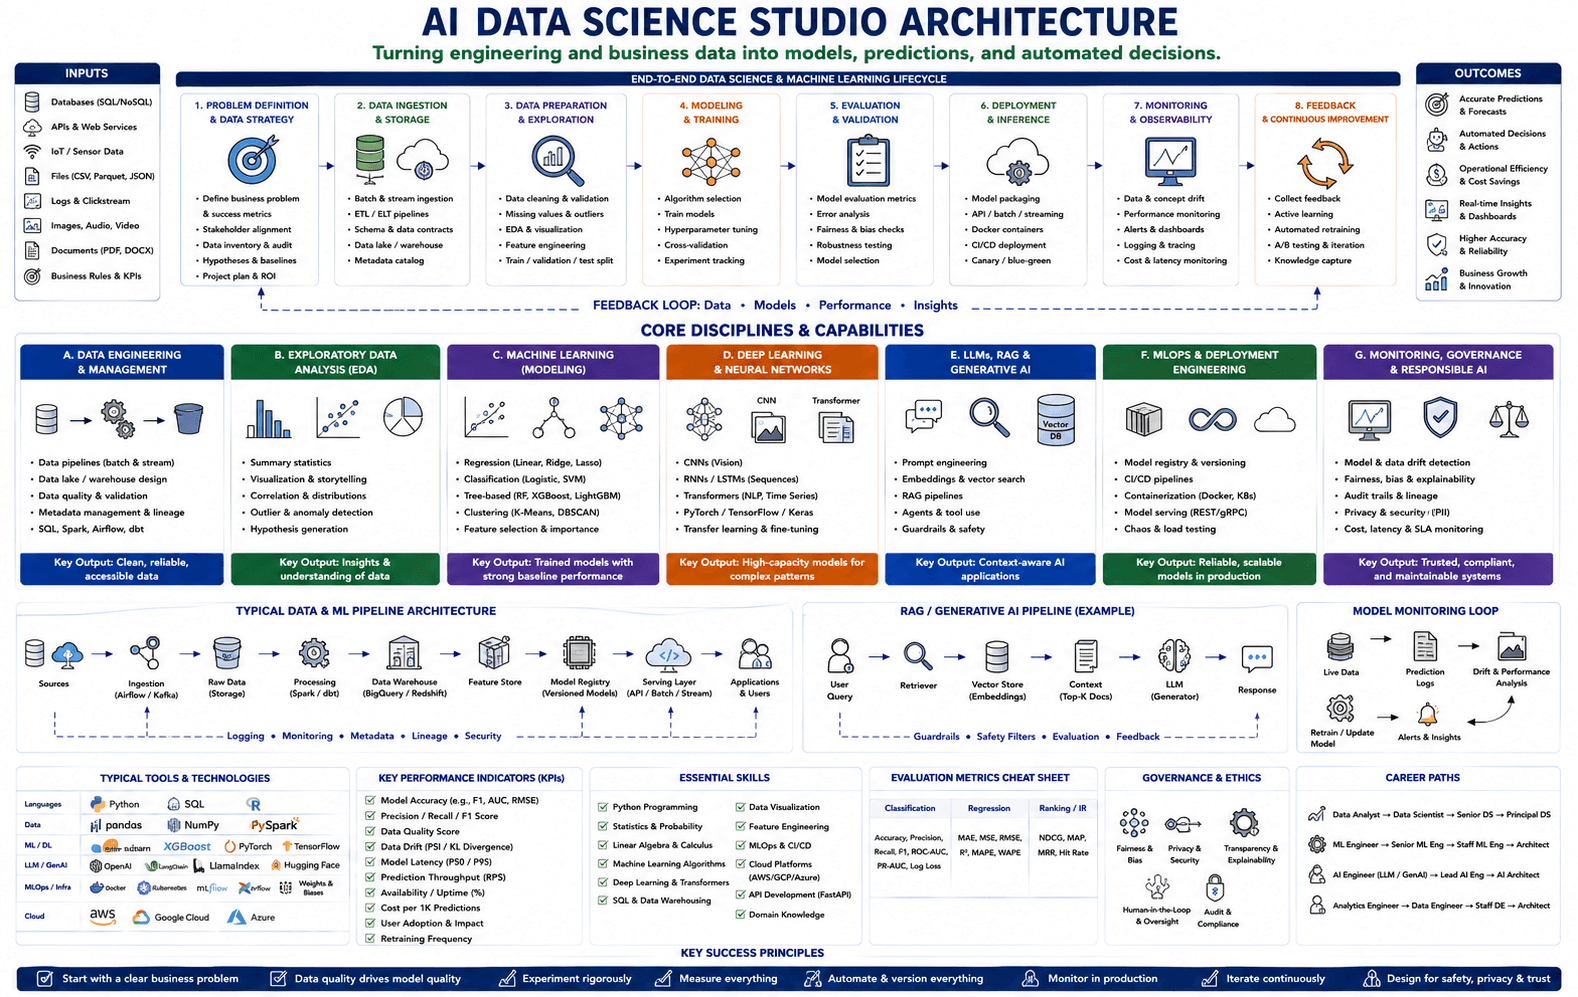
Hover, tap, or focus any component on the drawing (or a circuit below it) for details. Click to pin; move away or click again to clear.
Component Reference
Every component in the diagram above, grouped by section, with its role and the relevant standard.
Inputs
Databases (SQL/NoSQL)
Structured and semi-structured data sitting in relational (SQL) and document/key-value (NoSQL) databases — the most common starting point for any data science or ML project, from transactional systems to application backends.
APIs & Web Services
Data pulled programmatically from internal microservices and third-party web APIs — pricing feeds, weather data, geocoding, or partner systems — usually ingested on a schedule or via webhook.
IoT / Sensor Data
High-frequency telemetry streamed from connected devices and industrial sensors — temperature, vibration, GPS, energy meters — typically arriving as continuous time-series that need windowing before modeling.
Files (CSV, Parquet, JSON)
Batch exports and columnar files — CSV for interchange, Parquet for efficient analytical storage, JSON for nested/semi-structured records — that get picked up by ingestion jobs and loaded into the pipeline.
Logs & Clickstream
Application, server, and clickstream event logs capturing user behavior and system activity at high volume — the raw material for funnel analysis, anomaly detection, and behavioral models.
Images, Audio, Video
Unstructured multimedia — images, audio recordings, and video — that feeds computer-vision, speech, and multimodal models. Requires its own storage, labeling, and preprocessing path distinct from tabular data.
Documents (PDF, DOCX)
Unstructured text documents — PDFs, Word files, reports, manuals — that need extraction and chunking before they are usable, and are the primary source material for RAG knowledge bases.
Business Rules & KPIs
The business rules, constraints, and KPIs a project is judged against — not raw data, but the target definitions and guardrails that shape every downstream modeling and evaluation decision.
Outcomes
Accurate Predictions & Forecasts
Predictions, classifications, and forecasts accurate and reliable enough for the business to act on directly — the core deliverable every upstream step (data, training, evaluation) exists to make trustworthy.
Automated Decisions & Actions
Decisions and actions the system triggers automatically at a scale no manual process could match — routing, scoring, or flagging records the moment new data arrives.
Operational Efficiency & Cost Savings
Measurable efficiency gains and cost reductions from automating work that previously required manual analysis — one of the clearest, most defensible ROI arguments for a data science investment.
Real-time Insights & Dashboards
Live dashboards and streaming insight that surface what is happening right now rather than in last month's report — turning the data pipeline into an operational nervous system.
Higher Accuracy & Reliability
Continuously improving accuracy and reliability as models retrain on fresh data and feedback — the compounding payoff of a well-instrumented lifecycle rather than a one-off model.
Business Growth & Innovation
Revenue, retention, and new-product outcomes that tie the data science investment back to the original business goal — the final scoreboard that justifies the next round of investment.
Data Science & ML Lifecycle
1. Problem Definition & Data Strategy
Defines the business problem and success metrics, aligns stakeholders, audits available data, sets hypotheses and baselines, and builds the project plan and ROI case — the step that decides whether a data science approach is the right tool before any data work begins.
2. Data Ingestion & Storage
Builds batch and streaming ingestion pipelines, ETL/ELT jobs, and schema/data contracts, and lands the result in a data lake or warehouse with a metadata catalog — the plumbing every later stage depends on.
3. Data Preparation & Exploration
Cleans and validates the raw data, handles missing values and outliers, runs exploratory data analysis and visualization, engineers features, and carves out train/validation/test splits — the unglamorous work that most directly determines final model quality.
4. Modeling & Training
Selects the algorithm, trains models, tunes hyperparameters, runs cross-validation, and tracks every experiment so results are reproducible — the core research-and-engineering loop of building the model itself.
5. Evaluation & Validation
Measures model evaluation metrics, runs error analysis, checks for fairness and bias, tests robustness, and selects the final model — the gate a model must pass before it is trusted with real traffic.
6. Deployment & Inference
Packages the model, stands up an API/batch/streaming inference service, containerizes with Docker, wires up CI/CD deployment, and rolls out via canary or blue-green release to limit blast radius.
7. Monitoring & Observability
Tracks data and concept drift, monitors live performance, wires up alerts and dashboards, logs and traces requests, and watches cost and latency — the instrumentation that tells engineers when a production model is starting to fail silently.
8. Feedback & Continuous Improvement
Collects production feedback, applies active learning, triggers automated retraining, runs A/B tests, and captures knowledge back into the process — closing the loop so the lifecycle keeps improving rather than shipping once and going stale.
Feedback Loop: Data, Models, Performance, Insights
The dashed feedback loop that carries data quality signals, model performance, and insights from step 8 back to step 1 — the mechanism that makes the data science lifecycle a genuine loop instead of a one-way pipeline.
Core Disciplines & Capabilities
A. Data Engineering & Management — Pipelines & Storage
The data engineering foundation: pipelines that move data batch or stream, tooling and gears representing transformation, and the storage layer everything else in the diagram is built on top of.
A. Data Engineering & Management — Practices & Key Output
Data pipelines (batch & stream), data lake/warehouse design, data quality and validation, and metadata management and lineage, built with SQL, Spark, Airflow, and dbt. Key output: clean, reliable, accessible data — the foundation every other discipline depends on.
B. Exploratory Data Analysis (EDA) — Charts & Distributions
The visual toolkit of EDA — bar charts, scatter plots, and distribution/pie charts — used to understand a dataset's shape, relationships, and outliers before any model is trained.
B. Exploratory Data Analysis (EDA) — Practices & Key Output
Summary statistics, visualization and storytelling, correlation and distribution analysis, outlier/anomaly detection, and hypothesis generation. Key output: insights and understanding of the data that inform every modeling decision downstream.
C. Machine Learning (Modeling) — Regression, Trees & Clustering
The classical machine learning toolkit — regression curves, tree-based/graph models, and clustering — the algorithms engineers reach for first on structured, tabular problems.
C. Machine Learning (Modeling) — Practices & Key Output
Regression (linear, Ridge, Lasso), classification (logistic, SVM), tree-based ensembles (Random Forest, XGBoost, LightGBM), clustering (K-Means, DBSCAN), and feature selection/importance. Key output: trained models with strong baseline performance.
D. Deep Learning & Neural Networks — CNNs & Transformers
The deep-learning model family: general neural networks, convolutional networks (CNNs) for vision, and Transformer architectures for language and sequence data — used where classical ML runs out of capacity.
D. Deep Learning & Neural Networks — Practices & Key Output
CNNs (vision), RNNs/LSTMs (sequences), Transformers (NLP, time series), built with PyTorch, TensorFlow, and Keras, plus transfer learning and fine-tuning. Key output: high-capacity models for complex patterns classical ML cannot capture.
E. LLMs, RAG & Generative AI — Chat, Search & Vector DB
The generative-AI stack: a conversational interface, semantic/vector search, and a vector database storing embeddings — the three building blocks combined to build retrieval-augmented, context-aware applications.
E. LLMs, RAG & Generative AI — Practices & Key Output
Prompt engineering, embeddings and vector search, RAG pipelines, agents and tool use, and guardrails and safety. Key output: context-aware AI applications that ground generation in real, retrievable source material.
F. MLOps & Deployment Engineering — Packaging & Infra
The MLOps toolchain: a packaged model artifact, a CI/CD infinity loop representing continuous integration and delivery, and the cloud infrastructure that runs the whole thing in production.
F. MLOps & Deployment Engineering — Practices & Key Output
Model registry and versioning, CI/CD pipelines, containerization (Docker, K8s), model serving (REST/gRPC), and chaos and load testing. Key output: reliable, scalable models running in production.
G. Monitoring, Governance & Responsible AI — Dashboards & Ethics
The trust layer: a live monitoring dashboard, a shield representing security and trust, and a balance scale representing fairness — the instrumentation and ethics that keep production models accountable.
📘 NIST AI RMF 1.0G. Monitoring, Governance & Responsible AI — Practices & Key Output
Model and data drift detection, fairness/bias/explainability checks, audit trails and lineage, privacy and security (PII), and cost/latency/SLA monitoring. Key output: trusted, compliant, and maintainable systems.
Typical Data & ML Pipeline Architecture
Sources
The origin points of production data feeding the reference pipeline — databases, files, APIs, and streams — before anything is ingested or transformed.
Ingestion (Airflow / Kafka)
The ingestion layer, typically orchestrated with Apache Airflow for batch jobs and Apache Kafka for streaming, that pulls data from sources on a schedule or continuously.
Raw Data (Storage)
The durable, replayable landing zone where ingested data is stored in its original form before any cleaning or transformation — the source of truth for everything downstream.
Processing (Spark / dbt)
The transformation stage, run with Apache Spark or dbt, that cleans raw data and engineers the features a model will actually train on.
Data Warehouse (BigQuery / Redshift)
A managed analytical warehouse — BigQuery or Redshift — that stores cleaned, structured data for fast SQL-based analysis and downstream feature extraction.
Feature Store
A shared, versioned repository of engineered features that keeps training and low-latency serving consistent, so the same feature definition is used everywhere it is needed.
Model Registry (Versioned Models)
A versioned catalog of trained models with lineage and metadata, giving deployment a single, auditable source for "which model is production-ready."
Serving Layer (API / Batch / Stream)
The API, batch, or streaming inference layer that exposes the registered model to applications and users, handling request routing, batching, and scaling.
Applications & Users
The applications and end users that consume the model's predictions through the serving layer — the point where all the upstream engineering finally becomes a product.
Feedback: Logging, Monitoring, Metadata, Lineage, Security
The dashed feedback path that carries logging, monitoring signals, metadata, lineage, and security events from serving back up through the pipeline — closing the loop on the reference architecture.
RAG / Generative AI Pipeline
User Query
The natural-language question or prompt submitted by a user — the trigger for the whole retrieval-augmented-generation pipeline.
Retriever
The retrieval component that searches the vector store for the passages most semantically relevant to the user's query, using embedding similarity rather than keyword matching.
Vector Store (Embeddings)
A vector database storing document embeddings, enabling fast approximate-nearest-neighbor search so the retriever can find semantically similar content at scale.
Context (Top-K Docs)
The top-K retrieved passages assembled into a context block, inserted into the prompt alongside the original query so the LLM can ground its answer in real source material.
LLM (Generator)
The large language model that generates the final response, conditioned on both the user's query and the retrieved context — RAG's core trick for reducing hallucination versus an ungrounded LLM.
Response
The generated answer returned to the user, ideally grounded in the retrieved context and traceable back to its source documents.
Guardrails, Safety Filters, Evaluation, Feedback
The dashed feedback path that runs guardrails and safety filters on the response, evaluates quality, and logs feedback — the raw material for catching hallucinations and improving retrieval over time.
Model Monitoring Loop
Live Data
The live production data flowing into the deployed model right now — the starting point of the monitoring loop that keeps a model honest after launch.
Prediction Logs
Every prediction the model makes, logged with its input, output, and metadata — the audit trail that downstream drift and performance analysis is computed from.
Drift & Performance Analysis
Statistical analysis of prediction logs against the training baseline, detecting data and concept drift and performance degradation before it shows up as a business problem.
Retrain / Update Model
The retraining step that produces an updated model once drift or degraded performance is confirmed, then redeploys it back into the live-data path — closing the monitoring loop.
Alerts & Insights
Alerts and summarized insights pushed to the team when drift or performance analysis crosses a threshold — the human-in-the-loop trigger that starts the retrain decision.
Typical Tools & Technologies
Languages: Python, SQL, R
Python for general-purpose data science and ML, SQL for querying and transforming structured data, and R for statistical analysis — the three languages that cover almost every data science workflow.
Data: pandas, NumPy, PySpark
pandas and NumPy for in-memory data manipulation and numerical computing, and PySpark for distributed processing when a dataset outgrows a single machine.
ML/DL: scikit-learn, XGBoost, PyTorch, TensorFlow
scikit-learn for classical ML algorithms, XGBoost for gradient-boosted trees, and PyTorch/TensorFlow for deep learning — the frameworks that cover the full modeling spectrum.
LLM/GenAI: OpenAI, LangChain, LlamaIndex, Hugging Face
The OpenAI API for model access, LangChain and LlamaIndex for building RAG and agent pipelines, and Hugging Face for open pretrained models and fine-tuning.
MLOps/Infra: Docker, Kubernetes, mlflow, Airflow, Weights & Biases
Docker and Kubernetes for containerized deployment, mlflow for model tracking and registry, Airflow for pipeline orchestration, and Weights & Biases for experiment tracking.
Cloud: AWS, Google Cloud, Azure
AWS, Google Cloud, and Azure — the major cloud platforms supplying the storage, compute, and managed ML services most data science and MLOps stacks are built on.
Key Performance Indicators
Model Accuracy (e.g., F1, AUC, RMSE)
The core offline quality metric — F1/AUC for classification, RMSE for regression — used to judge whether a model is good enough to move toward production.
Precision / Recall / F1 Score
Precision, recall, and F1 give a finer-grained view of classification quality than raw accuracy alone, especially important on imbalanced datasets.
Data Quality Score
A composite score summarizing completeness, validity, and consistency of incoming data — an early-warning signal upstream of model performance itself.
Data Drift (PSI / KL Divergence)
Population Stability Index or KL divergence measuring how quickly the statistical distribution of production data diverges from the training distribution — an early warning that a model's assumptions are going stale.
Model Latency (P50 / P95)
Median (P50) and tail (P95) inference response time — tail latency matters more than average latency for user-facing experience.
Prediction Throughput (RPS)
Requests-per-second the serving layer can sustain — the capacity number that determines how much traffic the system can absorb before it needs to scale out.
Availability / Uptime (%)
The percentage of time the inference service is up and serving requests successfully — a standard SRE-style reliability metric applied to a model-serving system.
Cost per 1K Predictions
The direct cost of running 1,000 predictions — the unit-economics figure that determines whether a model is financially sustainable at scale.
User Adoption & Impact
Direct usage and adoption trends — the human-facing signal that complements offline metrics, since a statistically accurate model that users don't trust or use still fails.
Retraining Frequency
How often the model is retrained on fresh data — too infrequent and it goes stale against drift, too frequent and it wastes compute and risks instability.
Essential Skills
Python Programming
Python fluency — the baseline language for nearly every stage of the data science and ML lifecycle, from data wrangling to model deployment.
Statistics & Probability
The statistical and probabilistic foundation behind model behavior, evaluation metrics, and uncertainty quantification — essential for reading results correctly rather than just running code.
Linear Algebra & Calculus
Linear algebra and calculus underlie everything from gradient descent to neural network layers — the math that explains why models train the way they do.
Machine Learning Algorithms
Working knowledge of classical machine learning algorithms — regression, trees, clustering, ensembles — the modeling toolkit engineers draw on for most structured-data problems.
Deep Learning & Transformers
Neural network and Transformer architecture knowledge, needed for vision, language, and other high-dimensional, unstructured-data problems classical ML can't handle well.
SQL & Data Warehousing
SQL fluency and data warehouse design skills for querying, joining, and modeling the structured data that underlies most analytics and feature engineering work.
Data Visualization
The skill of turning raw data and model results into charts and dashboards that a non-technical stakeholder can actually understand and act on.
Feature Engineering
The craft of transforming raw data into the model-ready features that most directly drive predictive performance — often more impactful than algorithm choice.
MLOps & CI/CD
MLOps and CI/CD practices that ship models with the same discipline as software — automated testing, versioning, and repeatable deployment.
Cloud Platforms (AWS/GCP/Azure)
Cloud platform fluency — AWS, GCP, or Azure — for scaling training jobs and serving infrastructure beyond what a single machine can handle.
API Development (FastAPI)
API design skills, commonly with FastAPI, for wiring a trained model into a larger production system rather than leaving it as an isolated notebook.
Domain Knowledge
Subject-matter understanding of the business or engineering domain — often the difference between a technically correct model and one that actually solves the right problem.
Evaluation Metrics Cheat Sheet
Classification Metrics: Accuracy, Precision, Recall, F1, ROC-AUC, PR-AUC, Log Loss
The standard classification metric set — accuracy, precision, recall, F1, ROC-AUC, PR-AUC, and log loss — chosen depending on class balance and whether false positives or false negatives matter more.
Regression Metrics: MAE, MSE, RMSE, R², MAPE, WAPE
The standard regression metric set — MAE, MSE, RMSE, R², MAPE, and WAPE — used to judge how close a model's continuous predictions land to ground truth.
Ranking / IR Metrics: NDCG, MAP, MRR, Hit Rate
Ranking and information-retrieval metrics — NDCG, MAP, MRR, and Hit Rate — used to evaluate search, recommendation, and RAG retrieval quality where order matters, not just correctness.
Governance & Ethics
Fairness & Bias
Systematic testing for whether a model produces unequal outcomes across demographic or protected groups — a core governance check before any model touches real decisions about people.
📘 NIST AI RMF 1.0Privacy & Security
Data-handling and access-control practices that protect personal and sensitive information used in training and inference, in line with privacy regulation.
📘 GDPR / CCPATransparency & Explainability
Making model predictions interpretable to stakeholders — through techniques like SHAP and LIME — so decisions can be explained, audited, and contested when necessary.
Human-in-the-Loop & Oversight
Designing workflows where a human reviews or can override model decisions before they take effect — especially important for high-stakes or irreversible actions.
Audit & Compliance
Comprehensive logging and documentation of model inputs, outputs, and decisions, creating an audit trail that supports compliance reviews and post-incident investigation.
Career Paths
Data Analyst → Data Scientist → Senior DS → Principal DS
A common growth track from data analyst into data science, progressing from reporting and analysis toward independent modeling ownership at the senior and principal level.
ML Engineer → Senior ML Eng → Staff ML Eng → Architect
The applied machine-learning engineering track, progressing from building and productionizing models toward owning ML system architecture at the staff and architect level.
AI Engineer (LLM / GenAI) → Lead AI Eng → AI Architect
The generative-AI engineering track focused on LLMs, RAG, and agent systems, progressing from building AI-powered applications toward leading AI architecture decisions.
Analytics Engineer → Data Engineer → Staff DE → Architect
The data engineering track, progressing from analytics engineering into building and owning the pipelines and platforms every other role in this diagram depends on.
Key Success Principles
Start with a clear business problem
Every technical decision should trace back to the business problem defined in step 1 — a technically impressive model that doesn't serve the original problem is still a failure.
Data quality drives model quality
No amount of model sophistication compensates for poor training data — the data engineering discipline at the start of the pipeline sets the ceiling for everything after it.
Experiment rigorously
Run experiments with proper baselines, cross-validation, and experiment tracking rather than ad-hoc trial and error — the discipline that separates real progress from noise.
Measure everything
Track metrics across the entire pipeline — data quality, training, evaluation, production performance, and cost — not just a single offline accuracy number.
Automate & version everything
Version data, code, and models, and automate the pipelines that connect them — the foundation of reproducibility and fast, safe iteration.
Monitor in production
Deployment is not the finish line — continuous production monitoring catches drift, degradation, and failures long before users file complaints.
Iterate continuously
Treat the data science and ML lifecycle as a continuous loop, not a one-time project — retraining, re-evaluating, and improving as new data and feedback arrive.
Design for safety, privacy & trust
Bake safety, privacy, and trust into the system design from the start rather than bolting them on after launch — the difference between a compliant system and a retrofit.
Connections & Flows
The signal and data flows that tie the diagram together — each shown as a colored line in the legend above.
Process / Data Flow
The solid navy arrows tracing the primary path through each part of the diagram — the lifecycle stages, the pipeline stages, and the RAG pipeline — showing the main direction data and control move.
Feedback / Monitoring Loop
The dashed loops carrying feedback, monitoring signal, and operational metadata back upstream — from step 8 to step 1 in the lifecycle, from serving back to sources in the reference pipeline, and from response back to guardrails in the RAG example.